Showing posts with label map. Show all posts

Thursday, May 31, 2012

Adult and youth literacy in 2010

The UNESCO Institute for Statistics (UIS) released new literacy data in April 2012, with updated estimates of adult and youth literacy. In 2010, the latest year with data, 84% of the global population 15 years and older were estimated to be able to read and write (see Table 1). At the regional level, literacy rates are highest in Central Asia, Central and Eastern Europe, East Asia and the Pacific, and Latin America and the Caribbean. In these regions at least 9 out of 10 adults are literate. Literacy rates can be assumed to be as high in North America and Western Europe but not enough countries in that region collect literacy data to allow the calculation of a regional average. By contrast, adult literacy rates are significantly lower in the Arab States (75%), and in South and West Asia and sub-Saharan Africa (63% in both regions). Women are considerably less likely to be literate than men in the Arab States, East Asia and the Pacific, South and West Asia, and sub-Saharan Africa. Globally, the female adult literacy rate was estimated to be 80% in 2010, compared to a literacy rate of 89% for men. As a consequence, nearly two thirds (497 million) of the adult illiterate population in 2010 (775 million) were women.

Table 1: Adult and youth literacy rate, 2010
Region Adult literacy rate (%) Youth literacy rate (%)
Total Male Female Total Male Female
Arab States 74.7 83.3 65.7 89.1 92.4 85.6
Central Asia 99.5 99.6 99.4 99.7 99.6 99.8
Central and Eastern Europe 97.9 99.0 97.0 99.1 99.3 98.9
East Asia and the Pacific 94.2 96.7 91.6 98.8 98.9 98.7
Latin America and the Caribbean 91.4 92.1 90.7 97.2 97.0 97.4
North America and Western Europe - - - - - -
South and West Asia 62.7 74.0 51.8 80.5 86.6 74.7
Sub-Saharan Africa 62.6 71.0 54.2 71.8 76.4 66.8
World 84.1 88.6 79.7 89.6 92.2 87.1
Source: UNESCO Institute for Statistics, Data Centre, April 2012

The disparities between regions with high and low literacy rates are readily apparent from the map in Figure 1, which displays the average literacy rate in the seven Education for All (EFA) regions with data listed in Table 1. For a description of the regional groupings, please refer to a past article about the EFA regions on this website.

Figure 1: Regional adult literacy rate, 2010

Source: UNESCO Institute for Statistics, Data Centre, April 2012. - Click image to enlarge.

Youth literacy rates, for the population 15 to 24 years of age, are higher than adult literacy rates in all regions as a result of improved access to education among younger generations. Globally, 90% of all youth are able to read and write. Central Asia, Central and Eastern Europe, East Asia and the Pacific, and Latin America and the Caribbean have reached or are approaching universal literacy among their young population. The same can be assumed for North America and Western Europe, but no regional average is available from the UIS (see Table 1 and Figure 2). The disparity in literacy rates between men and women is generally smaller among the population 15 to 24 years than among the population 15 years and older. Yet, in the Arab States, South and West Asia, and sub-Saharan Africa, young women remain less likely to be able to read and write than young men. The global youth literacy rate in 2010 was 92% for men and 87% for women.

Figure 2: Regional youth literacy rate, 2010

Source: UNESCO Institute for Statistics, Data Centre, April 2012. - Click image to enlarge.

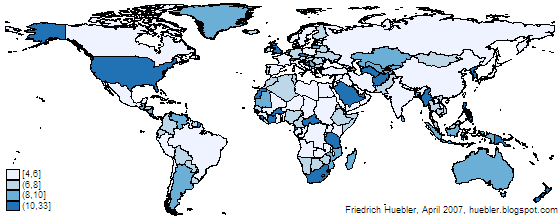
The regional averages can conceal large differences between countries within a region. This is particularly true for the adult literacy rate in the Arab States, South and West Asia, and sub-Saharan Africa (see Figure 3). In sub-Saharan Africa, for example, the adult literacy rate is below 30% in Burkina Faso and Niger - the countries with the least literate population worldwide - and above 90% in Equatorial Guinea, Seychelles, and Zimbabwe.

Figure 3: Adult literacy rate, 2010

Source: UNESCO Institute for Statistics, Data Centre, April 2012. - Click image to enlarge.

Disparities between countries within a region can also be observed for the youth literacy rate, but to a lesser degree than for the adult literacy rate (see Figure 4). Similar to the adult literacy rate, the greatest disparities exist in sub-Saharan Africa, where youth literacy rates range from 37% in Niger to 99% in the Seychelles and Zimbabwe.

Figure 4: Youth literacy rate, 2010

Source: UNESCO Institute for Statistics, Data Centre, April 2012. - Click image to enlarge.

To make it easier to explore its literacy data, the UNESCO Institute for Statistics has created an interactive visualization that combines a map showing adult and youth literacy rates, a graph with literacy rates by sex, and a scatter plot with the correlation between GDP per capita and literacy. A screenshot of the visualization is shown in Figure 5. The full visualization is available on the website of the UIS. Literacy data are also contained in the recently published World Atlas of Gender Equality in Education by UNESCO.

Figure 5: UIS data visualization with adult and youth literacy rate, 2010

Source: UNESCO Institute for Statistics, May 2012. - Click image to enlarge.

Related articles
External links
Friedrich Huebler, 31 May 2012 (edited 1 June 2012), Creative Commons License
Permanent URL: http://huebler.blogspot.com/2012/05/literacy.html

Saturday, March 31, 2012

World Atlas of Gender Equality in Education

Cover of the UNESCO gender atlasUNESCO and the UNESCO Institute for Statistics (UIS) have published a new World Atlas of Gender Equality in Education that illustrates the participation of girls and boys in pre-primary, primary, secondary, and tertiary education. The data show that there has been significant progress towards gender parity since the 1970s. Two thirds of all countries have reached gender parity in primary education but at the secondary level of education girls are still lagging behind. In some countries, girls have the advantage with regard to access to and completion of education. At the tertiary level, female students outnumber male students in many high-income countries.

The atlas is divided into eight chapters that contain a total of 28 maps and close to 100 charts and tables:

  1. Increased worldwide demand for quality schooling
  2. Girls’ right to education
  3. Enrolment and gender trends: primary education
  4. Enrolment and gender trends: secondary education
  5. Enrolment and gender trends: tertiary education
  6. Trends in school-life expectancy
  7. Gender trends: adult and youth literacy
  8. How policies affect gender equality in education
An excerpt from Chapter 7 on literacy is shown below. The map (please click the image for a larger view) visualizes adult literacy rates from the database of the UNESCO Institute for Statistics. Among countries with data, literacy rates are lowest in sub-Saharan Africa and South Asia. The highest adult literacy rates are observed in Eastern Europe and Central Asia. For many developed countries, the adult literacy rate is unknown because these countries have achieved universal primary education and no longer report data on the traditional literate-illiterate dichotomy, focusing instead on the more narrowly defined concept of functional literacy.

The atlas is available in English, French and Spanish. In addition, UNESCO and UIS plan to launch an online e-atlas with interactive maps.

Excerpt from World Atlas of Gender Equality in Education: Map with adult literacy rates
World map with adult literacy rates
Source: UNESCO, 2012, World Atlas of Gender Equality in Education, pages 92-93. - Click image to enlarge.

Reference

External links
Related articles
Friedrich Huebler, 31 March 2012, Creative Commons License
Permanent URL: http://huebler.blogspot.com/2012/03/atlas.html

Friday, September 30, 2011

Adult and youth literacy in 2009

8 September was International Literacy Day. On this occasion, the UNESCO Institute for Statistics (UIS) released a fact sheet with estimates of adult and youth literacy in 2009, the most recent year with data.

The global adult literacy rate, for the population 15 years and older, was 83.7% in 2009, compared to 83.4% in 2008. The adult illiterate population fell from 796.2 million in 2008 to 793.1 million in 2009. 64.1% of the adult illiterate population were women. Adult literacy rates are lowest in sub-Saharan African and in South and West Asia (see Figure 1). In 11 countries, less than half of the adult population were able to read and write: Benin, Burkina Faso, Chad, Ethiopia, Gambia, Guinea, Haiti, Mali, Niger, Senegal and Sierra Leone.

Figure 1: Adult literacy rate, 2009
World map with adult literacy rates in 2009
Source: UNESCO Institute for Statistics, 2011

Youth literacy rates - for the population 15 to 24 years - are generally higher than adult literacy rates, due to increased school attendance rates among younger generations. The global youth literacy rate was 89.3% in 2009, compared to 89.0% in 2008. The youth illiterate population fell from 130.6 million in 2008 to 127.3 million in 2009. Youth literacy rates are lowest in sub-Saharan Africa (see Figure 2) and the five countries worldwide with youth literacy rates below 50% are from this region: Burkina Faso, Chad, Ethiopia, Mali and Niger.

Figure 2: Youth literacy rate, 2009
World map with youth literacy rates in 2009
Source: UNESCO Institute for Statistics, 2011

Reference
  • UNESCO Institute for Statistics (UIS). 2011. Adult and youth literacy. UIS fact sheet no. 16, September. Montreal: UIS. (Download in PDF format, 350 KB)
Related articles
External links
Friedrich Huebler, 30 September 2011, Creative Commons License
Permanent URL: http://huebler.blogspot.com/2011/09/literacy.html

Saturday, March 26, 2011

Education for All regions

For monitoring of progress towards the six Education for All (EFA) goals, the world has been divided into eight EFA regions:
  • North America and Western Europe
  • Central and Eastern Europe
  • Central Asia
  • East Asia and the Pacific
  • South and West Asia
  • Arab States
  • Sub-Saharan Africa
  • Latin America and the Caribbean
These regions, shown in the map below, are used in publications like the EFA Global Monitoring Report by UNESCO or the Global Education Digest by the UNESCO Institute for Statistics.

Regions for monitoring of Education for All goals
World map with Education for All (EFA) regions

Combined, the eight EFA regions cover 204 countries and territories. Two EFA regions - East Asia and the Pacific, and Latin America and the Caribbean - are further divided into two sub-regions.

Composition of EFA regions
  • North America and Western Europe (26 countries and territories)
    Andorra, Austria, Belgium, Canada, Cyprus, Denmark, Finland, France, Germany, Greece, Iceland, Ireland, Israel, Italy, Luxembourg, Malta, Monaco, Netherlands, Norway, Portugal, San Marino, Spain, Sweden, Switzerland, United Kingdom, United States.
  • Central and Eastern Europe (21 countries)
    Albania, Belarus, Bosnia and Herzegovina, Bulgaria, Croatia, Czech Republic, Estonia, Hungary, Latvia, Lithuania, Montenegro, Poland, Republic of Moldova, Romania, Russian Federation, Serbia, Slovakia, Slovenia, The former Yugoslav Republic of Macedonia, Turkey, Ukraine.
  • Central Asia (9 countries)
    Armenia, Azerbaijan, Georgia, Kazakhstan, Kyrgyzstan, Mongolia, Tajikistan, Turkmenistan, Uzbekistan.
  • East Asia and the Pacific (33 countries and territories)
    East Asia (16 countries and territories)
    Brunei Darussalam, Cambodia, China, Democratic People's Republic of Korea, Indonesia, Japan, Lao People's Democratic Republic, Macao (China), Malaysia, Myanmar, Philippines, Republic of Korea, Singapore, Thailand, Timor-Leste, Viet Nam.
    Pacific (17 countries and territories)
    Australia, Cook Islands, Fiji, Kiribati, Marshall Islands, Micronesia (Federated States of), Nauru, New Zealand, Niue, Palau, Papua New Guinea, Samoa, Solomon Islands, Tokelau, Tonga, Tuvalu, Vanuatu.
  • South and West Asia (9 countries)
    Afghanistan, Bangladesh, Bhutan, India, Iran (Islamic Republic of), Maldives, Nepal, Pakistan, Sri Lanka.
  • Arab States (20 countries and territories)
    Algeria, Bahrain, Djibouti, Egypt, Iraq, Jordan, Kuwait, Lebanon, Libyan Arab Jamahiriya, Mauritania, Morocco, Occupied Palestinian Territory, Oman, Qatar, Saudi Arabia, Sudan, Syrian Arab Republic, Tunisia, United Arab Emirates, Yemen.
  • Sub-Saharan Africa (45 countries)
    Angola, Benin, Botswana, Burkina Faso, Burundi, Cameroon, Cape Verde, Central African Republic, Chad, Comoros, Congo, Côte d'Ivoire, Democratic Republic of the Congo, Equatorial Guinea, Eritrea, Ethiopia, Gabon, Gambia, Ghana, Guinea, Guinea-Bissau, Kenya, Lesotho, Liberia, Madagascar, Malawi, Mali, Mauritius, Mozambique, Namibia, Niger, Nigeria, Rwanda, Sao Tome and Principe, Senegal, Seychelles, Sierra Leone, Somalia, South Africa, Swaziland, Togo, Uganda, United Republic of Tanzania, Zambia, Zimbabwe.
  • Latin America and the Caribbean (41 countries and territories)
    Latin America
    (19 countries)
    Argentina, Bolivia (Plurinational State of), Brazil, Chile, Colombia, Costa Rica, Cuba, Dominican Republic, Ecuador, El Salvador, Guatemala, Honduras, Mexico, Nicaragua, Panama, Paraguay, Peru, Uruguay, Venezuela (Bolivarian Republic of).
    Caribbean
    (22 countries and territories)
    Anguilla, Antigua and Barbuda, Aruba, Bahamas, Barbados, Belize, Bermuda, British Virgin Islands, Cayman Islands, Dominica, Grenada, Guyana, Haiti, Jamaica, Montserrat, Netherlands Antilles, Saint Kitts and Nevis, Saint Lucia, Saint Vincent and the Grenadines, Suriname, Trinidad and Tobago, Turks and Caicos Islands.
References
  • UNESCO. 2011. EFA Global Monitoring Report 2011: The hidden crisis: Armed conflict and education. Paris: UNESCO. Annex, p. 269. (Download in PDF format, 6.4 MB)
  • UNESCO Institute for Statistics (UIS). 2010. Global education digest 2010: Comparing education statistics across the world. Montreal: UIS. Annex, p. 274-275. (Download in PDF format, 8 MB)
Related articles
External links
Friedrich Huebler, 26 March 2011, Creative Commons License
Permanent URL: http://huebler.blogspot.com/2011/03/efa.html

Sunday, May 30, 2010

Primary school entrance age and duration

Education for All (EFA) and the Millennium Development Goals (MDG) both aim at universal primary education. All children worldwide should attend and complete primary school by 2015. However, national education systems differ and the meaning of primary education for all children therefore varies from country to country.

The UNESCO Institute for Statistics (UIS) maintains a database with the entrance age and duration of primary education for 204 countries and territories. Table 1 summarizes the distribution of primary school entrance ages from the UIS database. In nearly two thirds of all countries, children are expected to enter primary school when they are 6 years old. In a further third of countries, the entrance age is 5 or 7 years. Two countries have different primary school entrance ages, Ireland with 4 years and Mongolia with 8 years..

Table 1: Primary school entrance age
Age Countries Percent
4 years 1 0.5
5 years 29 14.2
6 years 126 61.8
7 years 47 23.0
8 years 1 0.5
Total 204 100.0
Source: UIS Data Centre, May 2010.

The geographic distribution of the entrance ages is shown in the map in Figure 1. 6 years is the common primary school start age in most of North and South America, Western Europe, Africa, the Arab States, and East Asia, with some exceptions. 7 years is more common in Eastern Europe, Central Asia, and parts of Sub-Saharan Africa. 7 years is also the primary school start age in some large countries: Brazil, China and Russia.

Figure 1: Primary school entrance age
World map with national primary school entrance ages
Source: UIS Data Centre, May 2010.

The duration of primary school, shown in Table 2, ranges from 3 to 8 years. In 126 of 204 countries and territories, primary school has a duration of 6 years. In about 25 countries each, the duration is 4, 5 or 7 years. The shortest duration, 3 years, is reported for Armenia, Russia and Turkmenistan. In Ireland, which has the earliest entrance age with 4 years, children have to attend primary school for 8 years.

Table 2: Primary school duration
Age Countries Percent
3 years31.5
4 years 26 12.8
5 years 23 11.3
6 years 126 61.8
7 years 25 12.3
8 years 1 0.5
Total 204 100.0
Source: UIS Data Centre, May 2010.

The map in Figure 2 illustrates the primary school duration by country. 6 years is the most frequent duration in North and South America, East Asia and the Pacific, the Arab States and most of Africa except for Southern Africa, where 7 years is the most common primary school duration. In Central and Eastern Europe, Central Asia, and South and West Asia, primary education is typically shorter, with a duration of 4 or 5 years.

Figure 2: Primary school duration
World map with national primary school duration
Source: UIS Data Centre, May 2010.

What are the implications of the different primary school entrance ages and durations for the MDG and EFA goal of universal primary education by 2015? The official duration of primary education is closely linked to the number of children out of school. As an example, assume that a country has a primary school duration of 5 years and that the number of children in and out of school is evenly distributed across the official primary school ages. Shortening the duration of primary school from 5 to 4 years would immediately reduce the number of children out of school by 20 percent. However, the primary school net enrollment rate, the official indicator for the MDG of universal primary education, would not change and the country would therefore not be closer to the 2015 goal.

Related articles
External links
Friedrich Huebler, 30 May 2010, Creative Commons License
Permanent URL: http://huebler.blogspot.com/2010/05/age.html